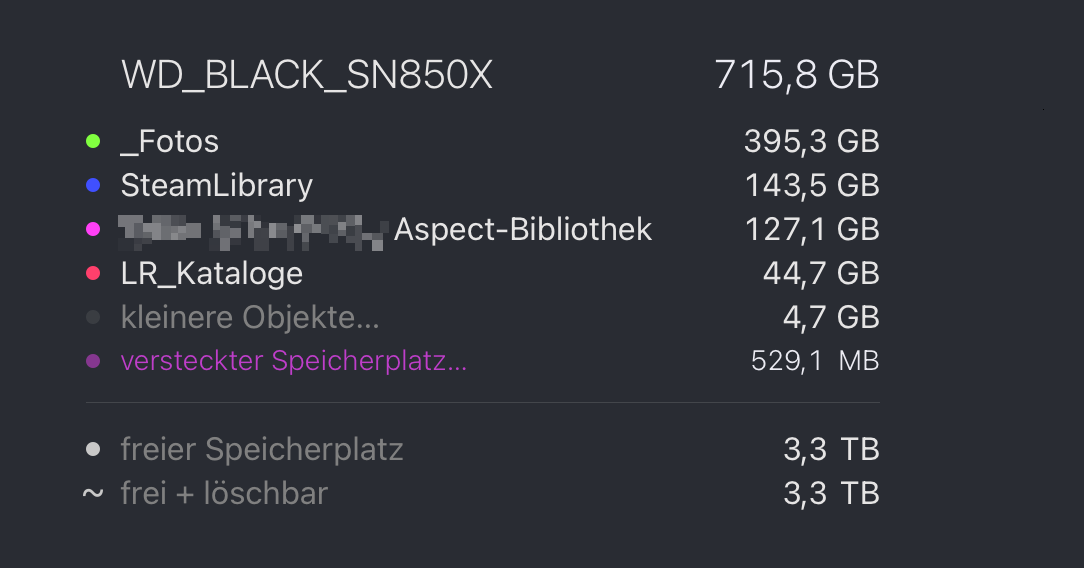
The handling of the library, however, less so. It takes around 47 seconds to start Aspect when reading in the library on a fast SSD connected to Thunderbolt 4 on my Mac Studio Max M1. The fact that the library is stored on the same drive as the photos would not be a problem if the size were more manageable. In my case, the library alone takes up around 124.5 GB with around 398 GB of photos. As it is still a beta, I can definitely see potential for optimisation here.
This definitely sounds unusual, a library with this amount of typically sized photos should usually result in a library catalog/cache that has less than 3% of the size of the photos, so around 10 GB would be typical in this case. The load time on a machine and storage like that would also be at around maybe 3 seconds.
To get a better idea what could be the source of this:
Roughly, how many photos/videos does the library contain? Is there possibly also a large amount of other kinds of files?
Which file system type (e.g. exFAT or APFS) does the SSD have?
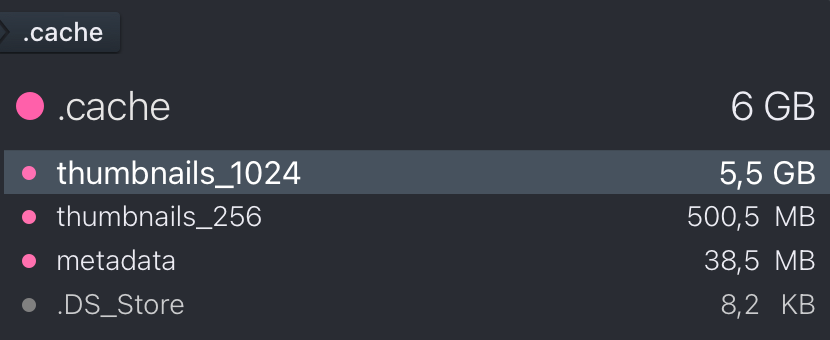
Within the library folder, there is a hidden .cache folder. The size of the three contained folders would be interesting, in order to pinpoint where the 124 GBs are used up.
It feels a bit like something might cause the photos to be added to the cache repeatedly, causing it to grow more or less indefinitely. Roughly judging by the numbers, this appears to behave more like a library that has more than 1,000,000 files.
If you have the chance, you could also send me the log file at $TMPDIR/aspect-log.sdl (opening a Terminal and typing open $TMPDIR + hitting return should open a finder window with the folder that contains aspect-log.sdl). That should at least give a clue where the time during the library load is actually being spent.
Okay, so the cache size looks alright, which means that the size must com from somewhere else. Did you possibly already move some of the photos into the managed library structure (e.g. by creating new events from a selection of photos or dragging them somewhere into the left pane)? If so, there should be some year folders within the library folder that contain photos that were previously in the original photo folder.
I’ve taken a look at where the time is getting used up and it’s not yet clear what exactly the reason is. The step that is responsible is the one that groups together all files/photos within the library according to their file name (e.g. DSC0000.jpg and DSC0000.xmp would form a group). But this is generally a very quick process.
One possibility would be that the “Analyzing images” stage hasn’t finished so far, or that something has lead to the file checksums not being computed correctly. Is “Analyzing images” still coming up, or did the application crash earlier? In the former case, things might just speed up when it’s finished.
I’ll see if I can reproduce something here tomorrow.
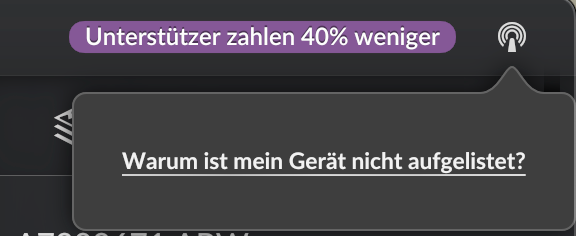
Yes, I have moved some of the photos into the managed library structure. There are exactly two new events from a selection of photos. But I remember clicking on “Why is my device not listed”, whereupon Aspect froze and I had to hard quit Aspect. It’s possible that the analysis phase was not yet complete; I wasn’t paying attention.
Yeah, unless I’m forgetting something, the list that shows all Aspect devices in the local network appears in three places, the “join library” dialog, the “add device to library” dialog and when pressing that antenna button. The hang/force quit should only result in an issue if there was some process still going.
But anyway, the hang also occurs here for me and was caused somewhere along the way by changes in external code, so we didn’t notice it so far. I’ve filed an internal issue (#1367) and implemented a fix.
There are still a few other things left to finish, but my plan for later today is then to create a new library from a large collection of photos and terminate the process while the image analysis is only partly finished, to see whether that causes something similar.
@DigitalAndy To remedy the immediate issue, you could try to just delete the .cache folder while the application is not running. This will cause the metadata to be re-read the next time the library is loaded and the “analyzing images” process will need to run again, but will ensure that all checksums and cached metadata is pristine.
Before you do that though, please do keep a copy of the Aspect Library File.aspectnode file in the library folder around somewhere else, so that it’s still possible to have a look at it for further diagnostics – just in case I’m not able to reproduce this myself.
I deleted the .cache folder and then had Aspect re-analyze the images. I have not noticed any changes. Loading the library still takes an extremely long time and I still have 127 GB for the library. I then checked the space requirements again in more detail. It is my 2 events on the left that are taking up the space.
Okay, it looks like I’m not able to reproduce the issue. I’ve tried several times to terminate it at various different points during the library creation and image analysis processes, but it always continued flawlessly afterwards and the portion where it hangs for you doesn’t even take a hundredth of a second in my tests.
So the last option to get to the bottom of this would be to take a look at the catalog file (Aspect Library File.aspectnode). Would it be possible for you to send that to me, assuming there is nothing sensitive in there? If so, the best channel would be via a direct message here, or via e-mail (soenke at bildhuus.com).
Just to quickly get back to this - through a lucky incident we found and fixed the root cause for this issue in the current preview 41 release. There was a seemingly unrelated issue that could be reproduced more easily, which turned out to be caused by the same root issue.
Sönke, thank you very much for thinking of this problem after all this time. I had taken a short break from my tests due to work, but I have already installed the new version and will be diving into it again shortly. I am very pleased that the problem has been resolved.